
Reports & attribution
Each event answers the two questions that matter — how is it selling, and who actually turned up — plus, on the marketing side, which channel deserves the credit.
Where to find it: open your event, then Insights → Reports or Insights → Attribution in the sidebar.
Event reports
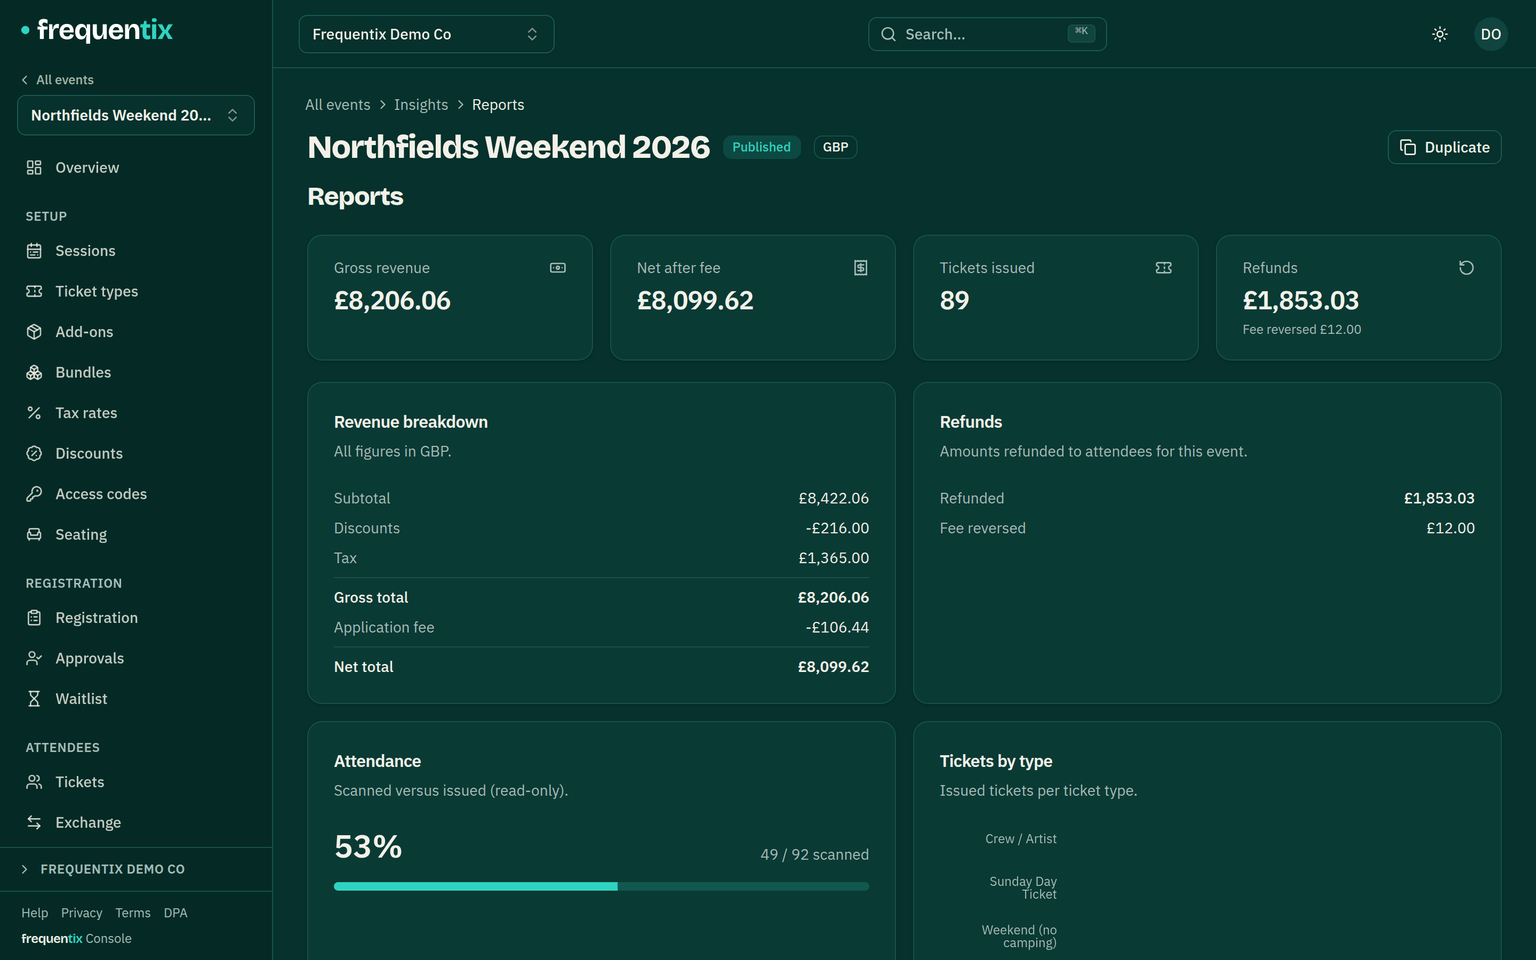
- Revenue — sales by ticket type and add-on, gross and net, alongside refunds. Where you sell gift cards, two extra lines name what was sold in cards and how much of your takings was paid with one — a card is a sale when you sell it and again inside the order it later pays for, so subtracting the second from your gross gives the money that actually came in.
- The platform fee shown is what we actually charged, not what your prices work out to. Those differ where a sale never carried a fee: cash at the door is the main one — we can’t take a cut of money that never passes through us, so a cash-heavy event shows a smaller fee and a larger net than its ticket prices alone would suggest.
- Attendance — scanned vs sold, so you can see show-up rate live on the night from the same numbers Scanner writes.
- On a run, numbers break down per date; the organiser dashboard shows the same health signals across events. Report figures may run up to half a minute behind — buyer-facing stock never does.
Exports
Eight surfaces export as CSV, for the spreadsheet work the console shouldn’t pretend to replace: an event’s tickets, orders, companies and exhibitor leads, the organiser-wide contacts list, the invoice ledger, your Gift Aid claim schedule, and an entry point’s scans. Every export needs a two-step-verified session, and erased contacts never appear in any of them.
Attribution
Attribution links tag a channel — the newsletter, a poster QR, a partner site. Each link records its page views and the sales that followed, so the Attribution report shows a funnel per source: views → orders → revenue. Print one on the poster, put another in the newsletter, and stop guessing which one sold. It’s all cookie-free: counts are aggregated per channel, no individual visitor is tracked, and untagged traffic simply files under “direct”.